Back
Back


Table of Contents
 01-May-2026
Author-James Smith
A Gantt Chart is a visual roadmap that transforms complex tasks into an organised timeline, making progress easier to track and manage. With its neatly aligned bars marching across a timeline, it shows who’s doing what, when and how every moving piece fits together. In short, it’s a storytelling canvas for project progress.
From defining key components to applying best practices, Gantt Charts bring coordination and control to projects of any size. In this blog, we'll explore What is a Gantt Chart and how they help teams deliver results with confidence and precision. So read on and make project success unstoppable!
What is a Gantt Chart?
A Gantt Chart is a Project Management tool used to monitor the progress of tasks and activities. It serves as a visual timeline, outlining tasks with start and end dates, milestones, dependencies and assigned resources. As a roadmap, a Gantt Chart helps teams schedule and coordinate their work efficiently.
By clearly showing task relationships, it promotes better collaboration and alignment among stakeholders. A well-structured, easy-to-read Gantt Chart ensures that all team members stay informed and work toward a shared objective.

History of the Gantt Chart
The origins of the Gantt Chart date back to 1896, when Polish Engineer Karol Adamiecki developed an early version called the harmonogram. But his work was published in Russian and Polish, which limited its reach in English-speaking regions. In 1910, American engineer Henry Gantt independently introduced a similar concept in the United States to track the time factory workers spent on tasks. Both approaches contributed to the evolution of the modern Gantt Chart used today.
Initially used for monitoring factory operations, Gantt Charts soon became a standard tool for managing project schedules. Early versions were drawn manually, requiring complete redrawing whenever changes occurred. Project Managers later used movable paper strips or blocks to represent tasks, making it easier to adjust timelines as needed.
Who Should Use Gantt Charts?
Gantt Charts are not limited to Project Managers. They are useful for anyone responsible for coordinating tasks across timelines and teams. The main roles that benefit the most include:
1) Project Managers: Project Managers rely on Gantt Charts for end-to-end planning and oversight across multiple projects. The visual layout helps them identify conflicts, allocate resources and communicate progress clearly to stakeholders.
2) Operations Managers: Operations Managers utilise Gantt Charts to oversee ongoing processes and optimise resource usage. Since operations often involve repetitive activities, these charts help maintain efficiency via better coordination and scheduling.
3) Team Leads: Team Leads use Gantt Charts to manage tasks within their teams or departments. They can track availability, anticipate bottlenecks and make sure that the team’s deliverables align with overall project schedules.
Go beyond the basics with the PRINCE2® Practitioner Course which transforms Managers into strategic leaders - Sign up now!
Key Components of a Gantt Chart
Without a clear understanding of the components, managing complex projects becomes significantly more challenging. Each of these components plays an important role in planning, tracking and execution:
1) Task List: This is a complete list of activities required for the project. It helps break work into manageable phases and deliverables.
2) Task Duration: This represents how long each task will take. Teams can adjust timelines by setting start and end dates directly on the chart.
3) Project Milestones: These are key checkpoints in the project timeline. They highlight important achievements and help stakeholders track progress.
4) Dependencies: These are connections between tasks that indicate the order of execution. They indicate which tasks must be completed before others can begin.
5) Project Timeline: This is the horizontal timeline where all tasks, milestones, and dependencies are mapped out for clear scheduling.
6) Project Resources: This includes the people, tools, and assets assigned to tasks. Most charts display team members involved in the project.
7) Critical Path: This is the longest sequence of dependent tasks that determines the project’s minimum completion time. It highlights tasks that directly impact deadlines.
8) Progress Bars: These are visual indicators showing the completion percentage of each task, helping teams monitor real-time progress.
9) Project Baseline: This is the original project plan used as a reference point to compare planned progress against actual performance.
Key Features of a Gantt Chart Software
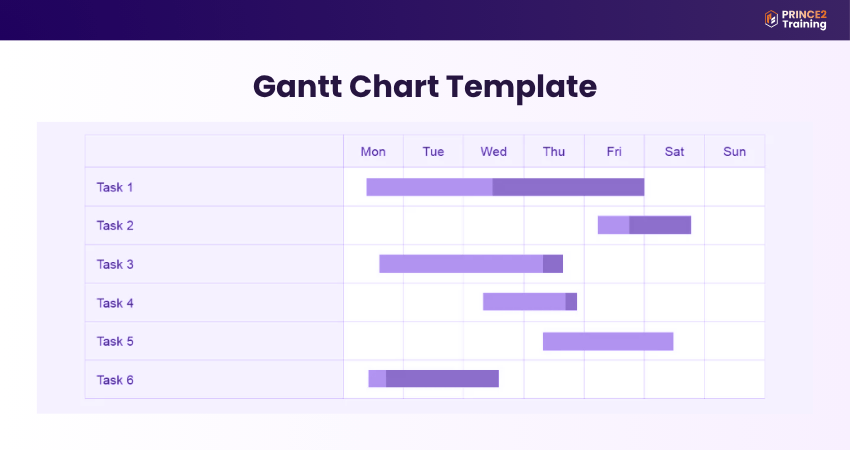
Gantt Charts are typically divided into two main sections: the left side displays a list of tasks, while the right side presents a timeline with bars that visually represent the schedule. This dual structure makes it easy for teams to understand both task details and overall project progress at a glance. Let’s explore the main features that make Gantt Chart Software effective:
1) Dependencies
Dependencies define the relationships between the tasks and determine the order in which they must be completed. They ensure that tasks follow a logical sequence and are executed correctly. Modern tools can automatically adjust schedules when changes occur, helping prevent delays and ensuring prerequisite tasks are completed first.
2) Milestones
Milestones in a Gantt Chart represent key points in the project timeline that highlight major progress or the completion of important phases. Using appropriate tools, these milestones can be marked clearly to help teams stay aligned with critical deadlines and objectives. For example, a Product Development team may set a milestone for completing the prototype stage, indicating readiness for user testing.
3) Resource Allocation
A project must be broken down into smaller, manageable work items that capture task details and progress updates. This keeps teams aligned and informed throughout the project. Effective resource allocation ensures workloads are balanced and that the right skills are assigned to the right tasks, improving efficiency and reducing the risk of bottlenecks or burnout.
4) List
A task list includes all activities required to complete the project and serves as the foundation for planning and execution. It allows teams to assign and prioritise tasks efficiently. With clear task ownership and deadlines, team members stay accountable, thus enabling smoother workflows and better project outcomes.
5) Timeline
The timeline gives a visual overview of the project schedule by spotlighting the start and end dates across the top of the chart. It helps teams understand task sequences, durations and the overall project flow. By offering clear visibility, timelines help identify bottlenecks early and allow teams to make timely adjustments to stay on track.
How to Create a Gantt Chart?
Now that you understand what a Gantt Chart is, the next step is learning how to build one effectively. Creating a Gantt Chart requires careful planning and clarity before using any tool. Here’s a step-by-step approach to get started:
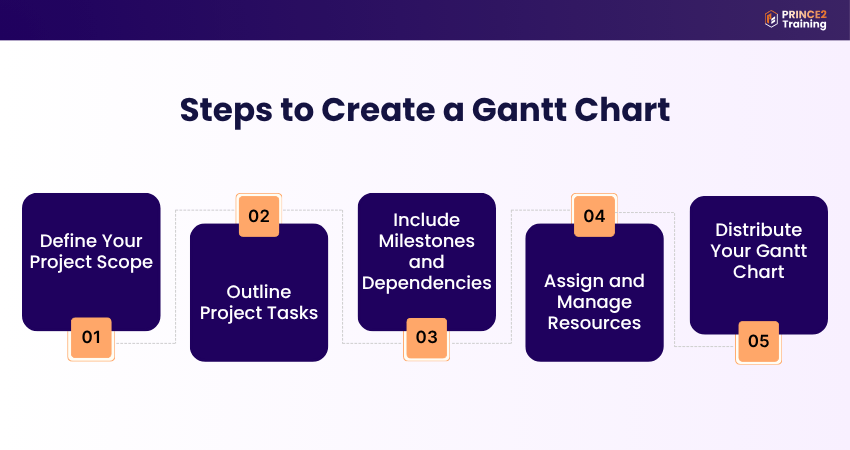
1) Define Your Project Scope
Start by defining the foundation of your project. Clearly outline goals, objectives, deliverables, and key deadlines. Also identify team members, assign roles (such as using a RACI matrix), and consider constraints like budget or supply chain challenges that may impact the timeline.
2) Outline Project Tasks
Once the scope is set, break the project down into individual tasks. Assign responsibilities, set start and end dates, and organise tasks using Project Management tools. Many platforms allow you to adjust timelines using their drag-and-drop features or alternative views like Kanban or lists.
3) Include Milestones and Dependencies
Next, include milestones to highlight key achievements and assign their respective dates. Establish dependencies by linking related tasks to ensure the correct sequence. This step is crucial for maintaining workflow continuity and preventing delays caused by unmet prerequisites.
4) Assign and Manage Resources
Use the Gantt Chart to monitor team workloads and ensure balanced resource allocation. Identify if team members are overburdened or underutilised and adjust task assignments accordingly to maintain productivity and avoid burnout.
5) Distribute Your Gantt Chart
Finally, share the completed Gantt Chart with your team, stakeholders, and clients. Whether through software links, email or printed copies, sharing ensures transparency and keeps everyone aligned on timelines, responsibilities, and project expectations.
Lead adaptive projects with confidence using the PRINCE2 Agile® Practitioner Training - Sign up now!
When to Use (and Avoid) Gantt Charts?
Gantt Charts are highly effective in certain situations, but they may not be suitable for every type of project. They are best suited for:
1) Large, Timeline-driven Projects: Ideal for projects with multiple phases, structured timelines, and interdependent tasks.
2) Cross-functional Initiatives: Useful when collaboration is required across different teams or departments, ensuring alignment and coordination.
3) Client-facing Work: Helps provide stakeholders with a clear view of progress, timelines, and key deliverables.
However, despite their strong visual capabilities, Gantt Charts can add unnecessary complexity in simpler scenarios. Consider alternative approaches when:
1) Managing Small, Flexible Projects: Agile workflows, such as Kanban boards, may be more suitable for handling short and dynamic tasks.
2) Working With Frequently Changing Requirements: Static timelines can quickly become outdated, making them less effective in rapidly evolving environments.
3) Handling Creative Projects: Projects that require flexibility and experimentation may not fit well within a linear, structured format.
Advantages and Disadvantages of Gantt Charts
Like most Project Management tools, Gantt Charts offer both strengths and limitations. Here are the advantages of Gantt Charts:
1) They offer a complete overview of the project, keeping teams aligned
2) They improve resource planning and the overall efficiency
3) They clearly display tasks and dependencies which simplifies complex projects
4) They support realistic scheduling and deadline setting
5) They encourage team motivation by showing visible progress
Here are some drawbacks of Gantt Charts:
1) They can be time-consuming to set up at the beginning of a project
2) They may become cluttered and difficult to interpret in highly complex projects
3) They do not reflect task complexity or workload effort
4) They require ongoing effort to maintain, especially with multiple dependencies
5) They lack built-in prioritisation, which may lead to confusion in task importance
Every great Project Manager starts with a solid foundation. Build yours with the PRINCE2® Foundation Training - Sign up now!
Gantt Chart Best Practices
By following proven best practices, Gantt Charts can become powerful tools for improving visibility, coordination, and overall project outcomes. When used correctly, they not only track timelines but also enhance decision-making and team efficiency. Consider the following best practices:
1) Allocate Resources Effectively
Proper resource allocation ensures that the right people, tools, and budgets are assigned to each task. Gantt Charts help visualise both timelines and resource distribution, making it easier to manage workloads. This prevents overloading team members and ensures balanced utilisation of resources across the project. For example, in event planning, while one team manages venue setup, another handles catering, ensuring parallel progress.
2) Track Progress Consistently
Gantt Charts must be updated consistently to reflect real-time progress. Integrating dashboards provides quick insights into task completion and resource usage. For example, in an Agile sprint, dashboards alongside Gantt Charts can highlight delays instantly, which enables quick adjustments without lengthy discussions.
3) Map Task Dependencies
Understanding how tasks are linked ensures that work follows a logical sequence. Dependencies show which tasks must be completed before others can begin. This prevents scheduling conflicts. For example, in construction, foundational work must be completed before building the walls, which ensures proper sequencing.
4) Apply a Work Breakdown Structure
A Work Breakdown Structure (WBS) involves dividing the project into smaller, manageable tasks and subtasks. When integrated into a Gantt Chart, it improves organisation and clarity. This structured approach makes it easier to assign responsibilities, track progress, and ensure nothing is overlooked. For example, in a website project, tasks such as design, development, and content creation are broken down and mapped clearly, helping teams understand roles and deadlines.
5) Identify the Critical Path
Identifying the critical path highlights the sequence of tasks that directly affect the completion date of a project. It distinguishes between critical tasks and those with flexibility. For example, in a software project, delays in coding can affect testing and deployment, while documentation tasks may have flexibility. This helps prioritise essential activities.
Gantt Chart Example
Reviewing a Gantt Chart example helps illustrate how to effectively structure and manage a project lifecycle:
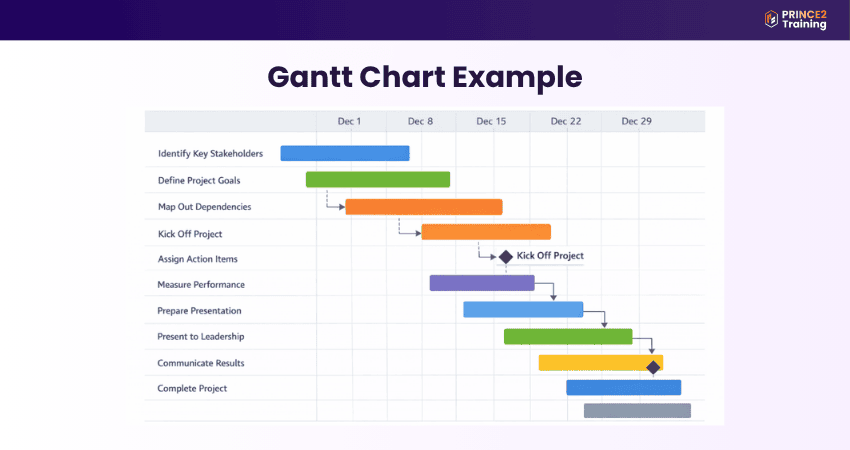
1) Initial Stage: The project begins with tasks such as “Identify key stakeholders,” which form the foundation for all subsequent activities.
2) Planning and Project Launch: Activities like “Define project goals” and “Map out dependencies” are scheduled to run in parallel, with deadlines such as December 15. The “Kick off project” task serves as a key milestone, marking the transition from planning to execution.
3) Task Management: Ongoing tasks like “Assign action items” and “Measure performance against goals” reflect continuous monitoring and distribution of responsibilities throughout the project.
4) Finalisation and Reporting: As the project nears completion, tasks such as “Prepare presentation” and “Present to leadership” guide stakeholders through the final stages. The closing phase includes activities like “Communicate results” and “Complete project,” ensuring proper wrap-up and clear delivery of outcomes.
Conclusion
A Gantt Chart guides projects from concept to completion with precision. By understanding What is a Gantt Chart, its components and applying best practices, teams can collaborate better and stay on track. Embracing this visual tool empowers organisations to turn timelines and ideas into successful, well-executed outcomes.
Build smarter, scalable projects with the PRINCE2® Certification - Sign up now!
Frequently Asked Questions?
Before creating a Gantt Chart, it's essential to define the project scope, objectives and deliverables. You must also identify tasks, timelines, resources and dependencies to ensure the chart is accurate and meaningful.
A Gantt Chart is a popular visual tool for displaying project timelines and task progress, while Microsoft Project is a comprehensive software suite that includes Gantt Charts. In simple terms, a Gantt Chart is a feature, whereas Microsoft Project is a full Project Management solution.
Gantt Charts are most effective for large, structured and timeline-driven projects with multiple tasks and dependencies. They are especially useful for construction, Software Development, event planning and cross-functional initiatives that require clear scheduling and coordination.